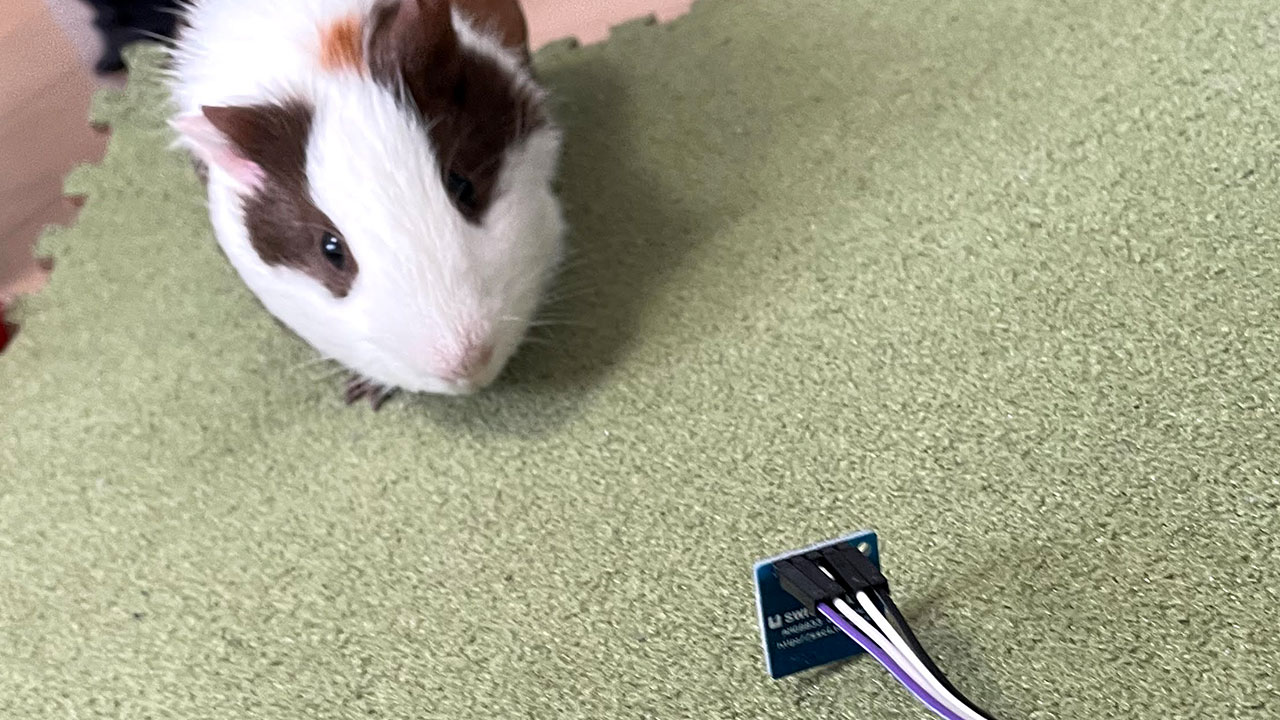
サーモグラフィー「AMG8833」で取得した温度データをブラウザで表示します。ブラウザまで持ってくれば、Web系の制作者にとって視覚化が簡単になります。
開発環境
ハード
Raspberry Pi 3 model B+
スイッチサイエンス「AMG8833」モジュール
ソフト
OS:raspbian 10.7
Python 3.7.3
Node.js 10.21.0
Chromium 86
検温ボタンで温度配列取得

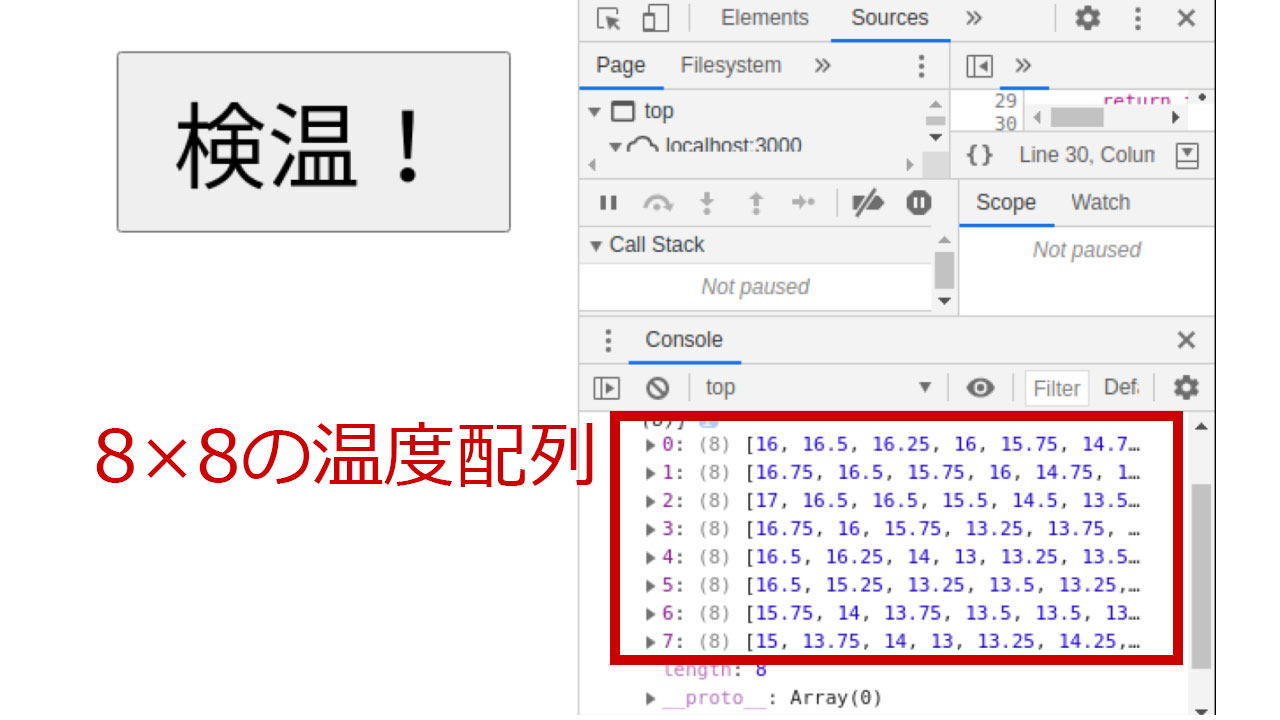
今回は、ラズパイの標準ブラウザChromiumで、「検温!」ボタンを押した時、Consoleに8×8の温度配列を表示するところまで進めます。
処理の流れとしては、
HTML→Node.js→Python→センサー→Python→Node.js→HTML
・・・と、なかなか遠回りです。しかし、HTMLまでセンサーデータを持ってくれば、Web系の人にとっては自由度が増すでしょう。
ディレクトリ構造
htdocs/
┗thermal-camera.html(検温ボタンのあるHTML)
python/
┗amg8833.py(センサー値を取得するPython)
app.js(サーバーとなるNode.js)
app.js(Node.js)のコード
Node.jsはExpressを使い、Webサーバーとして立てます。
HTMLとはsocket.io(Websoket)でデータをやり取りし、PythonとはPythonShellでデータをやり取りします。
|
1 2 3 4 5 6 7 8 9 10 11 12 13 14 15 16 17 18 19 20 21 22 23 24 25 26 27 28 29 30 31 32 33 34 35 36 37 38 |
const express = require('express'); const app = express(); const http = require('http').createServer(app); const io = require('socket.io')(http); const PORT = 3000; const { PythonShell } = require('python-shell'); const init = () => { app.use(express.static('htdocs')); io.on('connection', (socket) => { socket.on('msg', (msg) => { if(msg === 'thermal'){ PythonShell.run('python/amg8833.py', null, (err, data) => { if (err) throw err; let array, result = []; array = data[0].substr(2).slice(0, -2).split("], ["); for (let i = 0; i < array.length; i++) { let val = array[i].split(", "); for (let j = 0; j < val.length; j++) { val[j] = Number(val[j]); } result.push(val); } io.emit('thermal', result); }); } }); }); http.listen(PORT, ()=>{ console.log(`接続ポート ${ PORT }`); }); }; init(); |
Pythonから受け取ったセンサーの配列が文字列となるので、JavaScriptで配列データに変換しています。17行目からがその処理です。もっと簡単な書き方があるかもしれません。
PythonShellで実行している「python/amg8833.py」のコードは下記になります。
amg8833.py(Python)のコード
|
1 2 3 4 5 6 7 8 |
import time import busio import board import adafruit_amg88xx i2c_bus = busio.I2C(board.SCL, board.SDA) sensor = adafruit_amg88xx.AMG88XX(i2c_bus, addr=0x68) time.sleep(.1) print(sensor.pixels) |
AMG8833センサーにアクセスし、8×8の温度配列データを出力します。
この出力結果が、node.jsに渡ります。
thermal-camera.html(HTML)のコード
最後にブラウザに表示するHTMLです。
|
1 2 3 4 5 6 7 8 9 10 11 12 13 14 15 16 17 18 19 20 21 22 23 24 25 26 27 28 29 30 31 32 33 34 35 36 |
<html> <head> <title>サーマルカメラ</title> <script src="//ajax.googleapis.com/ajax/libs/jquery/3.2.1/jquery.min.js"></script> <script src="//cdnjs.cloudflare.com/ajax/libs/socket.io/3.1.0/socket.io.js"></script> </head> <body> <main> <button type="button" id="thermalBtn">検温!</button> </main> <script> const socket = io(); const init = () => { setSocket(); setBtn(); }; const setSocket = () => { let array, result = []; socket.on('thermal', (data) => { console.log(data); }); }; const setBtn = () => { $('#thermalBtn').on('click', function(){ socket.emit('msg', 'thermal'); return false; }); }; init(); </script> </body> </html> |
「検温!」ボタンをクリックすると、Websocketで「thermal」というメッセージをNode.jsサーバーに渡します。
それをトリガーにして、温度取得が始まり、取得完了後にデータがまたWebsocketで戻ってくる仕組みです。
次回、canvasとCSSで、サーモグラフィーを作ります。
